Nagios is useful for monitoring pretty much any kind of network service, with a wide variety of community-made plugins to test pretty much anything you might need. However, its configuration and interface can be a little bit cryptic to initiates. Fortunately, Nagios is well-packaged in Debian and Ubuntu and provides a basic default configuration that is instructive to read and extend.
There’s a reason that a lot of system administrators turn into monitoring fanatics when tools like Nagios are available. The rapid feedback of things going wrong and being fixed and the pleasant sea of green when all your services are up can get addictive for any halfway dedicated administrator.
In this article I’ll walk you through installing a very simple monitoring setup
on a Debian or Ubuntu server. We’ll assume you have two computers in your home
network, a workstation on 192.168.1.1 and a server on 192.168.1.2, and that
you maintain a web service of some sort on a remote server, for which I’ll use
www.example.com. We’ll install a Nagios instance on the server that monitors
both local services and the remote webserver, and emails you if it detects any
problems.
For those not running a Debian-based GNU/Linux distribution or perhaps BSD, much of the configuration here will still apply, but the initial setup will probably be peculiar to your ports or packaging system unless you’re compiling from source.
Installing the packages
We’ll work on a freshly installed Debian Stable box as the server, which at the time of writing is version 6.0.3 “Squeeze”. If you don’t have it working already, you should start by installing Apache HTTPD:
# apt-get install apache2
Visit the server on http://192.168.1.1/ and check that you get the “It
works!”, and that should be all you need. Note that by default this
installation of Apache is not terribly secure, so you shouldn’t allow access to
it from outside your private network until you’ve locked it down a bit, which
is outside the scope of this article.
Next we’ll install the nagios3 package, which will include a default set of
useful plugins, and a simple configuration. The list of packages it needs to
support these is quite long so you may need to install a lot of dependencies,
which apt-get will manage for you.
# apt-get install nagios3
The installation procedure will include requesting a password for the
administration area; provide it with a suitable one. You may also get prompted
to configure a workgroup for the samba-common package; don’t worry, you
aren’t installing a samba service by doing this, it’s just information for
the smbclient program in case you want to monitor any SMB/CIFS services.
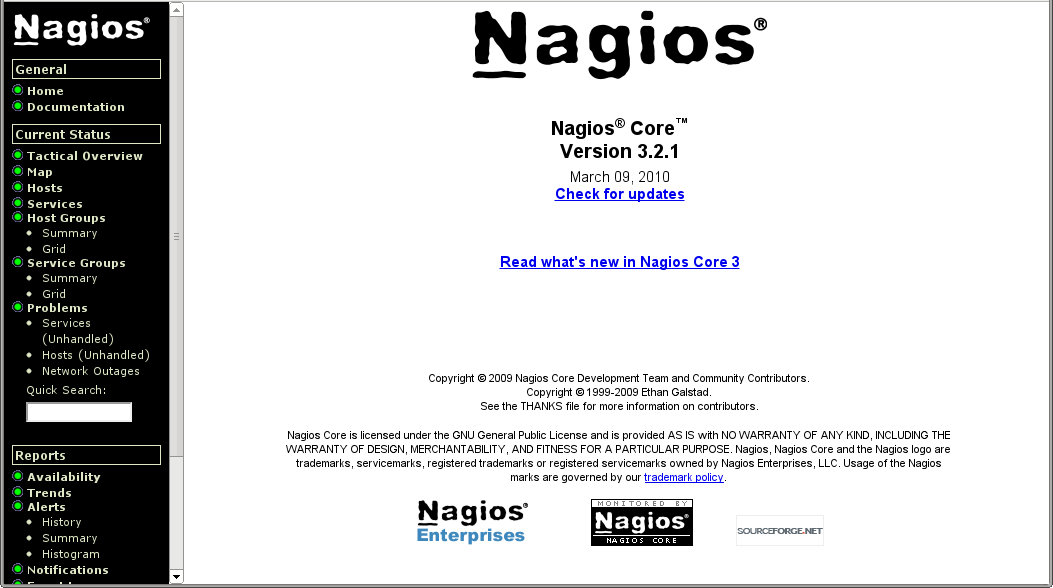
That should provide you with a basic self-monitoring Nagios setup. Visit
http://192.168.1.1/nagios3/ in your browser to verify this; use the username
nagiosadmin and the password you gave during the install process. If you see
something like the below, you’re in business; this is the Nagios web reporting
and administration panel.
Default setup
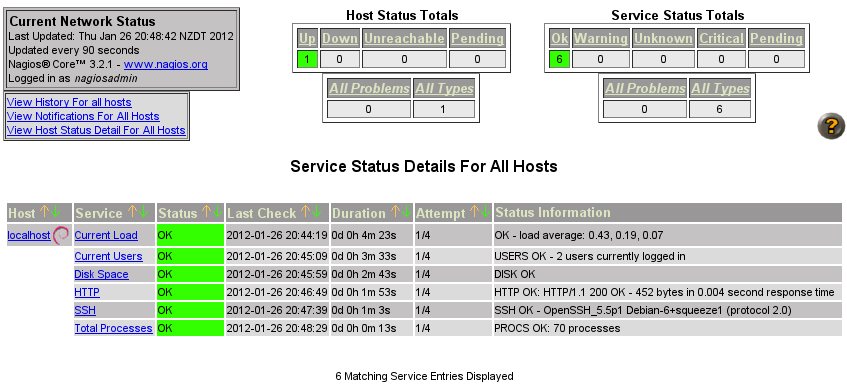
To start with, click the Services link in the left menu. You should see
something like the below, which is the monitoring for localhost and the
service monitoring that the packager set up for you by default:
Note that on my system, monitoring for the already-existing HTTP and SSH daemons was automatically set up for me, along with the default checks for load average, user count, and process count. If any of these pass a threshold, they’ll turn yellow for WARNING, and red for CRITICAL states.
This is already somewhat useful, though a server monitoring itself is a bit
problematic because of course it won’t be able to tell you if it goes
completely down. So for the next step, we’re going to set up monitoring for the
remote host www.example.com, which means firing up your favourite text
editor to edit a few configuration files.
Default configuration
Nagios configuration is at first blush a bit complex, because monitoring setups
need to be quite finely-tuned in order to be useful long term, particularly if
you’re managing a large number of hosts. Take a look at the files in
/etc/nagios3/conf.d.
# ls /etc/nagios3/conf.d
contacts_nagios2.cfg
extinfo_nagios2.cfg
generic-host_nagios2.cfg
generic-service_nagios2.cfg
hostgroups_nagios2.cfg
localhost_nagios2.cfg
services_nagios2.cfg
timeperiods_nagios2.cfg
You can actually arrange a Nagios configuration any way you like, including one big well-ordered file, but it makes some sense to break it up into sections if you can. In this case, the default setup includes the following files:
contacts_nagios2.cfgdefines the people and groups of people who should receive notifications and alerts when Nagios detects problems or resolutions.extinfo_nagios2.cfgmakes some miscellaneous enhancements to other configurations, kept in a separate file for clarity.generic-host_nagios2.cfgis Debian’s host template, defining a few common variables that you’re likely to want for most hosts, saving you repeating yourself when defining host definitions.generic-service_nagios2.cfgis the same idea, but it’s a template service to monitor.hostgroups_nagios2.cfgdefines groups of hosts in case it’s valuable for you to monitor individual groups of hosts, which the Nagios admin allows you to do.localhost_nagios2.cfgis where the monitoring for thelocalhosthost we were just looking at is defined.services_nagios2.cfgis where further services are defined that might be applied to groups.timeperiods_nagios2.cfgdefines periods of time for monitoring services; for example, you might want to get paged if a webserver dies 24/7, but you might not care as much about 5% packet loss on some international link at 2am on Saturday morning.
This isn’t my favourite method of organising Nagios configuration, but it’ll work fine for us. We’ll start by defining a remote host, and add services to it.
Testing services
First of all, let’s check we actually have connectivity to the host we’re monitoring from this server for both of the services we intend to check; ICMP ECHO (PING) and HTTP.
$ ping -n -c 1 www.example.com
PING www.example.com (192.0.43.10) 56(84) bytes of data.
64 bytes from 192.0.43.10: icmp_req=1 ttl=243 time=168 ms
--- www.example.com ping statistics --- 1 packets transmitted, 1 received,
0% packet loss, time 0ms rtt min/avg/max/mdev = 168.700/168.700/168.700/0.000 ms

$ wget www.example.com -O - | grep -i found
tom@novus:~$ wget www.example.com -O -
--2012-01-26 21:12:00--  http://www.example.com/
Resolving www.example.com... 192.0.43.10, 2001:500:88:200::10
Connecting to www.example.com|192.0.43.10|:80... connected.
HTTP request sent, awaiting response... 302 Found
...
All looks well, so we’ll go ahead and add the host and its services.
Defining the remote host
Write a new file in the /etc/nagios3/conf.d directory called
www.example.com_nagios2.cfg, with the following contents:
define host {
    use        generic-host
    host_name  www.example.com
    address    www.example.com
}
The first stanza of localhost_nagios2.conf looks very similar to this,
indeed, it uses the same host template, generic-host. All we need to do is
define what to call the host, and where to find it.
However, in order to get it monitoring appropriate services, we might need to
add it to one of the already existing groups. Open up hostgroups_nagios2.cfg,
and look for the stanza that includes hostgroup_name http-servers. Add
www.example.com to the group’s members, so that that stanza looks like this:
# A list of your web servers
define hostgroup {
    hostgroup_name  http-servers
    alias           HTTP servers
    members         localhost,www.example.com
}
With this done, you need to restart the Nagios process:
# service nagios3 restart
If that succeeds, you should notice under your Hosts and Services section is a new host called “www.example.com”, and it’s being monitored for HTTP. At first, it’ll be PENDING, but when the scheduled check runs, it should come back (hopefully!) as OK.
You can add other webhost monitoring the same way, by creating new hosts with
appropriate addresses and adding them to the http-servers group.
Email notification
If you have a mail daemon running on your server like exim4 or postfix
that’s capable of remote email delivery, you can edit contacts_nagios2.cfg
and change root@localhost to your own email address. Restart Nagios again,
and you should now receive an email alert each time a service goes up or down.
Further suggestions
This primer has barely scratched the surface of what you can do with Nagios. For further exercises, read the configuration files in a bit more depth, and see if you can get these working:
- Set up an
smtp-serversgroup, and add your ISP’s mail server to it so that you can monitor whether their SMTP process is up. Define the service for any host that’s in the group. - Add your private workstation to the hosts, but set it up so that it only notifies you if it goes down during working hours in your timezone.
- [Advanced] Automatically post notifications to your system’s MOTD.
In a future article, I’ll be describing how to use the Map functionality of
Nagios along with parent definitions to set up a very simple network
weathermap.
I have now completed my first book, the Nagios Core Administration Cookbook, which takes readers beyond the basics of monitoring with Nagios Core. Give it a look if this sounds interesting!

