Temporary files

With judicious use of tricks like pipes, redirects, and process substitution in modern shells, it’s very often possible to avoid using temporary files, doing everything inline and keeping them quite neat. However when manipulating a lot of data into various formats you do find yourself occasionally needing a temporary file, just to hold data temporarily.

A common way to deal with this is to create a temporary file in your home directory, with some arbitrary name, something like test or working:

$ ps -ef >~/test

If you want to save the information indefinitely for later use, this makes sense, although it would be better to give it a slightly more instructive name than just test.

If you really only needed the data temporarily, however, you’re much better to use the temporary files directory. This is usually /tmp, but for good practice’s sake it’s better to check the value of TMPDIR first, and only use /tmp as a default:

$ ps -ef >"${TMPDIR:-/tmp}"/test

This is getting better, but there is still a significant problem: there’s no built-in check that the test file doesn’t already exist, perhaps being used by some other user or program, particularly another running instance of the same script.

To that end, we have the mktemp program, which creates an empty temporary file in the appropriate directory for you without overwriting anything, and prints the filename it created. This allows you to use the file inline in both shell scripts and one-liners, and is much safer than specifying hardcoded paths:

$ mktemp
/tmp/tmp.yezXn0evDf
$ procsfile=$(mktemp)
$ printf '%s\n' "$procsfile"
/tmp/tmp.9rBjzWYaSU
$ ps -ef >"$procsfile"

If you’re going to create several such files for related purposes, you could also create a directory in which to put them using the -d option:

$ procsdir=$(mktemp -d)
$ printf '%s\n' "$procsdir"
/tmp/tmp.HMAhM2RBSO

On GNU/Linux systems, files of a sufficient age in TMPDIR are cleared on boot (controlled in /etc/default/rcS on Debian-derived systems, /etc/cron.daily/tmpwatch on Red Hat ones), making /tmp useful as a general scratchpad as well as for a kind of relatively reliable inter-process communication without cluttering up users’ home directories.

In some cases, there may be additional advantages in using /tmp for its designed purpose as some administrators choose to mount it as a tmpfs filesystem, so it operates in RAM and works very quickly. It’s also common practice to set the noexec flag on the mount to prevent malicious users from executing any code they manage to find or save in the directory.

Unix as IDE: Debugging

This entry is part 6 of 7 in the series Unix as IDE.

When unexpected behaviour is noticed in a program, GNU/Linux provides a wide variety of command-line tools for diagnosing problems. The use of gdb, the GNU debugger, and related tools like the lesser-known Perl debugger, will be familiar to those using IDEs to set breakpoints in their code and to examine program state as it runs. Other tools of interest are available however to observe in more detail how a program is interacting with a system and using its resources.

Debugging with gdb

You can use gdb in a very similar fashion to the built-in debuggers in modern IDEs like Eclipse and Visual Studio. If you are debugging a program that you’ve just compiled, it makes sense to compile it with its debugging symbols added to the binary, which you can do with a gcc call containing the -g option. If you’re having problems with some code, it helps to also use -Wall to show any errors you may have otherwise missed:

$ gcc -g -Wall example.c -o example

The classic way to use gdb is as the shell for a running program compiled in C or C++, to allow you to inspect the program’s state as it proceeds towards its crash.

$ gdb example
...
Reading symbols from /home/tom/example...done.
(gdb)

At the (gdb) prompt, you can type run to start the program, and it may provide you with more detailed information about the causes of errors such as segmentation faults, including the source file and line number at which the problem occurred. If you’re able to compile the code with debugging symbols as above and inspect its running state like this, it makes figuring out the cause of a particular bug a lot easier.

(gdb) run
Starting program: /home/tom/gdb/example 

Program received signal SIGSEGV, Segmentation fault.
0x000000000040072e in main () at example.c:43
43     printf("%d\n", *segfault);

After an error terminates the program within the (gdb) shell, you can type backtrace to see what the calling function was, which can include the specific parameters passed that may have something to do with what caused the crash.

(gdb) backtrace
#0  0x000000000040072e in main () at example.c:43

You can set breakpoints for gdb using the break to halt the program’s run if it reaches a matching line number or function call:

(gdb) break 42
Breakpoint 1 at 0x400722: file example.c, line 42.
(gdb) break malloc
Breakpoint 1 at 0x4004c0
(gdb) run
Starting program: /home/tom/gdb/example 

Breakpoint 1, 0x00007ffff7df2310 in malloc () from /lib64/ld-linux-x86-64.so.2

Thereafter it’s helpful to step through successive lines of code using step. You can repeat this, like any gdb command, by pressing Enter repeatedly to step through lines one at a time:

(gdb) step
Single stepping until exit from function _start,
which has no line number information.
0x00007ffff7a74db0 in __libc_start_main () from /lib/x86_64-linux-gnu/libc.so.6

You can even attach gdb to a process that is already running, by finding the process ID and passing it to gdb:

$ pgrep example
1524
$ gdb -p 1524

This can be useful for redirecting streams of output for a task that is taking an unexpectedly long time to run.

Debugging with valgrind

The much newer valgrind can be used as a debugging tool in a similar way. There are many different checks and debugging methods this program can run, but one of the most useful is its Memcheck tool, which can be used to detect common memory errors like buffer overflow:

$ valgrind --leak-check=yes ./example
==29557== Memcheck, a memory error detector
==29557== Copyright (C) 2002-2011, and GNU GPL'd, by Julian Seward et al.
==29557== Using Valgrind-3.7.0 and LibVEX; rerun with -h for copyright info
==29557== Command: ./example
==29557== 
==29557== Invalid read of size 1
==29557==    at 0x40072E: main (example.c:43)
==29557==  Address 0x0 is not stack'd, malloc'd or (recently) free'd
==29557== 
...

The gdb and valgrind tools can be used together for a very thorough survey of a program’s run. Zed Shaw’s Learn C the Hard Way includes a really good introduction for elementary use of valgrind with a deliberately broken program.

Tracing system and library calls with ltrace

The strace and ltrace tools are designed to allow watching system calls and library calls respectively for running programs, and logging them to the screen or, more usefully, to files.

You can run ltrace and have it run the program you want to monitor in this way for you by simply providing it as the sole parameter. It will then give you a listing of all the system and library calls it makes until it exits.

$ ltrace ./example
__libc_start_main(0x4006ad, 1, 0x7fff9d7e5838, 0x400770, 0x400760 
srand(4, 0x7fff9d7e5838, 0x7fff9d7e5848, 0, 0x7ff3aebde320) = 0
malloc(24)                                                  = 0x01070010
rand(0, 0x1070020, 0, 0x1070000, 0x7ff3aebdee60)            = 0x754e7ddd
malloc(24)                                                  = 0x01070030
rand(0x7ff3aebdee60, 24, 0, 0x1070020, 0x7ff3aebdeec8)      = 0x11265233
malloc(24)                                                  = 0x01070050
rand(0x7ff3aebdee60, 24, 0, 0x1070040, 0x7ff3aebdeec8)      = 0x18799942
malloc(24)                                                  = 0x01070070
rand(0x7ff3aebdee60, 24, 0, 0x1070060, 0x7ff3aebdeec8)      = 0x214a541e
malloc(24)                                                  = 0x01070090
rand(0x7ff3aebdee60, 24, 0, 0x1070080, 0x7ff3aebdeec8)      = 0x1b6d90f3
malloc(24)                                                  = 0x010700b0
rand(0x7ff3aebdee60, 24, 0, 0x10700a0, 0x7ff3aebdeec8)      = 0x2e19c419
malloc(24)                                                  = 0x010700d0
rand(0x7ff3aebdee60, 24, 0, 0x10700c0, 0x7ff3aebdeec8)      = 0x35bc1a99
malloc(24)                                                  = 0x010700f0
rand(0x7ff3aebdee60, 24, 0, 0x10700e0, 0x7ff3aebdeec8)      = 0x53b8d61b
malloc(24)                                                  = 0x01070110
rand(0x7ff3aebdee60, 24, 0, 0x1070100, 0x7ff3aebdeec8)      = 0x18e0f924
malloc(24)                                                  = 0x01070130
rand(0x7ff3aebdee60, 24, 0, 0x1070120, 0x7ff3aebdeec8)      = 0x27a51979
--- SIGSEGV (Segmentation fault) ---
+++ killed by SIGSEGV +++

You can also attach it to a process that’s already running:

$ pgrep example
5138
$ ltrace -p 5138

Generally, there’s quite a bit more than a couple of screenfuls of text generated by this, so it’s helpful to use the -o option to specify an output file to which to log the calls:

$ ltrace -o example.ltrace ./example

You can then view this trace in a text editor like Vim, which includes syntax highlighting for ltrace output:
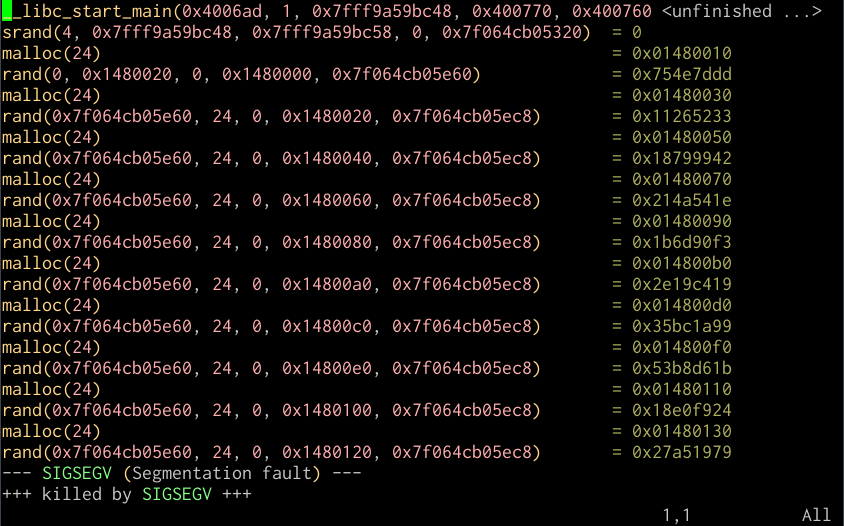
Vim session with ltrace output

Vim session with ltrace output

I’ve found ltrace very useful for debugging problems where I suspect improper linking may be at fault, or the absence of some needed resource in a chroot environment, since among its output it shows you its search for libraries at dynamic linking time and opening configuration files in /etc, and the use of devices like /dev/random or /dev/zero.

Tracking open files with lsof

If you want to view what devices, files, or streams a running process has open, you can do that with lsof:

$ pgrep example
5051
$ lsof -p 5051

For example, the first few lines of the apache2 process running on my home server are:

# lsof -p 30779
COMMAND   PID USER   FD   TYPE DEVICE SIZE/OFF    NODE NAME
apache2 30779 root  cwd    DIR    8,1     4096       2 /
apache2 30779 root  rtd    DIR    8,1     4096       2 /
apache2 30779 root  txt    REG    8,1   485384  990111 /usr/lib/apache2/mpm-prefork/apache2
apache2 30779 root  DEL    REG    8,1          1087891 /lib/x86_64-linux-gnu/libgcc_s.so.1
apache2 30779 root  mem    REG    8,1    35216 1079715 /usr/lib/php5/20090626/pdo_mysql.so
...

Interestingly, another way to list the open files for a process is to check the corresponding entry for the process in the dynamic /proc directory:

# ls -l /proc/30779/fd

This can be very useful in confusing situations with file locks, or identifying whether a process is holding open files that it needn’t.

Viewing memory allocation with pmap

As a final debugging tip, you can view the memory allocations for a particular process with pmap:

# pmap 30779 
30779:   /usr/sbin/apache2 -k start
00007fdb3883e000     84K r-x--  /lib/x86_64-linux-gnu/libgcc_s.so.1 (deleted)
00007fdb38853000   2048K -----  /lib/x86_64-linux-gnu/libgcc_s.so.1 (deleted)
00007fdb38a53000      4K rw---  /lib/x86_64-linux-gnu/libgcc_s.so.1 (deleted)
00007fdb38a54000      4K -----    [ anon ]
00007fdb38a55000   8192K rw---    [ anon ]
00007fdb392e5000     28K r-x--  /usr/lib/php5/20090626/pdo_mysql.so
00007fdb392ec000   2048K -----  /usr/lib/php5/20090626/pdo_mysql.so
00007fdb394ec000      4K r----  /usr/lib/php5/20090626/pdo_mysql.so
00007fdb394ed000      4K rw---  /usr/lib/php5/20090626/pdo_mysql.so
...
total           152520K

This will show you what libraries a running process is using, including those in shared memory. The total given at the bottom is a little misleading as for loaded shared libraries, the running process is not necessarily the only one using the memory; determining “actual” memory usage for a given process is a little more in-depth than it might seem with shared libraries added to the picture.

Unix as IDE: Files

This entry is part 2 of 7 in the series Unix as IDE.

One prominent feature of an IDE is a built-in system for managing files, both the elementary functions like moving, renaming, and deleting, and ones more specific to development, like compiling and checking syntax. It may also be useful to have operations on sets of files, such as finding files of a certain extension or size, or searching files for specific patterns. In this first article, I’ll explore some useful ways to use tools that will be familiar to most GNU/Linux users for the purposes of working with sets of files in a project.

Listing files

Using ls is probably one of the first commands an administrator will learn for getting a simple list of the contents of the directory. Most administrators will also know about the -a and -l switches, to show all files including dot files and to show more detailed data about files in columns, respectively.

There are other switches to GNU ls which are less frequently used, some of which turn out to be very useful for programming:

  • -t — List files in order of last modification date, newest first. This is useful for very large directories when you want to get a quick list of the most recent files changed, maybe piped through head or sed 10q. Probably most useful combined with -l. If you want the oldest files, you can add -r to reverse the list.
  • -X — Group files by extension; handy for polyglot code, to group header files and source files separately, or to separate source files from directories or build files.
  • -v — Naturally sort version numbers in filenames.
  • -S — Sort by filesize.
  • -R — List files recursively. This one is good combined with -l and piped through a pager like less.

Since the listing is text like anything else, you could, for example, pipe the output of this command into a vim process, so you could add explanations of what each file is for and save it as an inventory file or add it to a README:

$ ls -XR | vim -

This kind of stuff can even be automated by make with a little work, which I’ll cover in another article later in the series.

Finding files

Funnily enough, you can get a complete list of files including relative paths with no decoration by simply typing find with a . argument for the current directory, though you may want to pipe it through sort:

$ find . | sort
.
./Makefile
./README
./build
./client.c
./client.h
./common.h
./project.c
./server.c
./server.h
./tests
./tests/suite1.pl
./tests/suite2.pl
./tests/suite3.pl
./tests/suite4.pl

If you want an ls -l style listing, you can add -ls as the action to find results in GNU find(1):

$ find . -ls | sort -k11,11
1155096    4 drwxr-xr-x   4 tom      tom          4096 Feb 10 09:37 .
1155152    4 drwxr-xr-x   2 tom      tom          4096 Feb 10 09:17 ./build
1155155    4 -rw-r--r--   1 tom      tom          2290 Jan 11 07:21 ./client.c
1155157    4 -rw-r--r--   1 tom      tom          1871 Jan 11 16:41 ./client.h
1155159   32 -rw-r--r--   1 tom      tom         30390 Jan 10 15:29 ./common.h
1155153   24 -rw-r--r--   1 tom      tom         21170 Jan 11 05:43 ./Makefile
1155154   16 -rw-r--r--   1 tom      tom         13966 Jan 14 07:39 ./project.c
1155080   28 -rw-r--r--   1 tom      tom         25840 Jan 15 22:28 ./README
1155156   32 -rw-r--r--   1 tom      tom         31124 Jan 11 02:34 ./server.c
1155158    4 -rw-r--r--   1 tom      tom          3599 Jan 16 05:27 ./server.h
1155160    4 drwxr-xr-x   2 tom      tom          4096 Feb 10 09:29 ./tests
1155161    4 -rw-r--r--   1 tom      tom           288 Jan 13 03:04 ./tests/suite1.pl
1155162    4 -rw-r--r--   1 tom      tom          1792 Jan 13 10:06 ./tests/suite2.pl
1155163    4 -rw-r--r--   1 tom      tom           112 Jan  9 23:42 ./tests/suite3.pl
1155164    4 -rw-r--r--   1 tom      tom           144 Jan 15 02:10 ./tests/suite4.pl

Note that in this case I have to specify to sort that it should sort by the 11th column of output, the filenames; this is done with the -k option.

find has a complex filtering syntax all of its own; the following examples show some of the most useful filters you can apply to retrieve lists of certain files:

  • find . -name '*.c' — Find files with names matching a shell-style pattern. Use -iname for a case-insensitive search.
  • find . -path '*test*' — Find files with paths matching a shell-style pattern. Use -ipath for a case-insensitive search.
  • find . -mtime -5 — Find files edited within the last five days. You can use +5 instead to find files edited before five days ago.
  • find . -newer server.c — Find files more recently modified than server.c.
  • find . -type d — Find directories. For files, use -type f; for symbolic links, use -type l.

Note, in particular, that all of these can be combined, for example to find C source files edited in the last two days:

$ find . -name '*.c' -mtime -2

By default, the action find takes for search results is simply to list them on standard output, but there are several other useful actions:

  • -ls — Provide an ls -l style listing, as above (GNU find(1))
  • -delete — Delete matching files
  • -exec — Run an arbitrary command line on each file, replacing {} with the appropriate filename, and terminated by \;; for example:

    $ find . -name '*.pl' -exec perl -c {} \;
    

    You can use + as the terminating character instead if you want to put all of the results on one invocation of the command. One trick I find myself using often is using find to generate lists of files that I then edit in vertically split Vim windows:

    $ find . -name '*.c' -exec vim {} +
    

Earlier versions of Unix as IDE suggested the use of xargs with find results. In most cases this should not really be necessary, and it’s more robust to handle filenames with whitespace using -exec or a while read -r loop.

Searching files

More often than attributes of a set of files, however, you want to find files based on their contents, and it’s no surprise that grep, in particular grep -R, is useful here. This searches the current directory tree recursively for anything matching ‘someVar’:

$ grep -FR someVar .

Don’t forget the case insensitivity flag either, since by default grep works with fixed case:

$ grep -iR somevar .

Also, you can print a list of files that match without printing the matches themselves with grep -l:

$ grep -lR someVar .

If you write scripts or batch jobs using the output of the above, use a while loop with read to handle spaces and other special characters in filenames:

grep -lR someVar | while IFS= read -r file; do
    head "$file"
done

If you’re using version control for your project, this often includes metadata in the .svn, .git, or .hg directories. This is dealt with easily enough by excluding (grep -v) anything matching an appropriate fixed (grep -F) string:

$ grep -R someVar . | grep -vF .svn

Some versions of grep include --exclude and --exclude-dir options, which may be tidier.

With all this said, there’s a very popular alternative to grep called ack, which excludes this sort of stuff for you by default. It also allows you to use Perl-compatible regular expressions (PCRE), which are a favourite for many programmers. It has a lot of utilities that are generally useful for working with source code, so while there’s nothing wrong with good old grep since you know it will always be there, if you can install ack I highly recommend it. There’s a Debian package called ack-grep, and being a Perl script it’s otherwise very simple to install.

Unix purists might be displeased with my even mentioning a relatively new Perl script alternative to classic grep, but I don’t believe that the Unix philosophy or using Unix as an IDE is dependent on sticking to the same classic tools when alternatives with the same spirit that solve new problems are available.

File metadata

The file tool gives you a one-line summary of what kind of file you’re looking at, based on its extension, headers and other cues. This is very handy used with find when examining a set of unfamiliar files:

$ find . -exec file {} +
.:            directory
./hanoi:      Perl script, ASCII text executable
./.hanoi.swp: Vim swap file, version 7.3
./factorial:  Perl script, ASCII text executable
./bits.c:     C source, ASCII text
./bits:       ELF 32-bit LSB executable, Intel 80386, version ...

Matching files

As a final tip for this section, I’d suggest learning a bit about pattern matching and brace expansion in Bash, which you can do in my earlier post entitled Bash shell expansion.

All of the above make the classic UNIX shell into a pretty powerful means of managing files in programming projects.

Edited April 2017 to use POSIX-compatible examples for most of the find(1) invocations.